Tuesday 31 March 2009

Fun with aerial photography

Work has just been crazy and non-stop, a lot of it involving aerial photography ‘orthorectifying’. What that basically means is that I have a set of aerial photos that I am ‘stitching’ to an existing, known co-ordinate framework. This process is undertaken in a program called ArcMap, which is a GIS (Geographic Information System) style program.

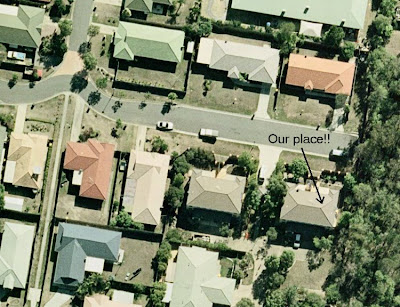
Brisbane City Council have provided me with aerial photography for their entire council area. Not only is this a huge area (Brisbane City Council is the largest metropolitan council in Australia), but the resolution of the imagery is 15cm! This means that each pixel is 15cm x 15cm, allowing a detailed assessment of habitat at an amazing resolution! See this example image that is of our new place, which is the !

There are three main ways that aerial photography is provided; all of which vary in their degree of work required to produce a final photo array and all of which vary in their eventual accuracy.

1) A third of all photos are already orthorectified when I receive them; Brisbane City Council’s photos (thankfully) fall into this category. What this means is that I open them, and they fit nicely onto a map with their spatial co-ordinates accurately presented.

2) Then, almost two thirds of aerial photos are static images that I have to stitch to the framework myself, although luckily this sort of photo has an additional ‘tab’ file that states what the SW, NW, NE and SE co-ordinates of the photo are. You then instruct the program to move the corners of the photos to the given spatial co-ordinates. This is still a very time-consuming exercise, and the other day, I spent over 6 days (including a lot of weekend time) performing this exercise on 380 photos for the entire 1996 Gold Coast Council area…
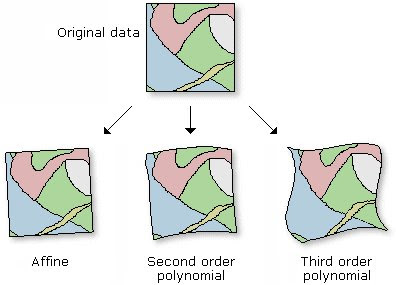
3) The third way that aerial photography is provided is literally static images with no reference to where they belong. With these photos, you basically have to match a given image feature (i.e., road intersection, driveway-road intersection, building corner) with a known spatial co-ordinate. So for example, if I have an aerial photo of my neighbourhood, and I know (using my GPS unit) that the corner of my street is 27.607° S, 153.074° E, I designate that ‘control point’ on the aerial photo, as that known spatial co-ordinate. The more control points that you do this with, the more accurate your image will reflect reality. This process of ‘orthorectifying’ is also known as ‘rubber-sheeting’ once you have enough matching points on the photo. Through a process called ‘1st order polynomial’ and ‘2nd order polynomial’ transformations, parts of the aerial photo are effectively stretched and contracted to best match their true spatial location; thus the term ‘rubber-sheeting’. The image on the right shows what I mean, and comes from the ArcGIS help webpage. THIS method of orthorectifying is the most time consuming and inaccurate method, as the manipulation of the photo based on your control points is like laying a sheet over the ground and while you may be able to relatively accurately anchor parts of that sheet to the ground (control points), those parts of the sheet between the points are not necessarily where they should be. In the end, you can reduce the ‘error’ between the aerial photo and where you say those control points should be by just increasing the number of control points....... all depends on how accurate you need the data to be…

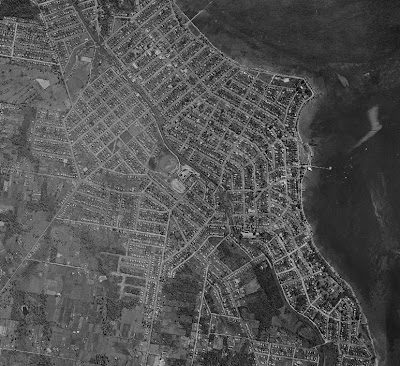
I have pasted below an interesting collection of photos from the Manly region of Brisbane. It shows a 2007 image (provided as a pre-orthorectified, according to the type 1 process as described above) image) of the region, and then a 1991 image (orthorectifying myself according to the type 3 process as described above), and finally a 1958 image that I managed to get my hands on and self orthorectify. It shows nicely the increase cover of development and reduced cover of native vegetation over 50 or so years! If you save them all and view them as a slideshow, you can see how you can accurately stitch photos on top of each other!


Wednesday 25 March 2009

Interesting new rainfall model...

I came across a fascinating article published on http://www.weatherzone.com.au/. It outlines a talk to be presented at the Greenhouse 2009 conference, and later, published in the Geophysical Research Letters journal. It represents a model that can predict rainfall and associated risk of bushfires, especially in Victoria, based on the oceanic temperature difference between the western and eastern parts of the Indian Ocean! By all appearances, it looks like the model fits rainfall data somewhat better than the traditional El Nino/La Nina system, although it invariably interacts with it in the global oceanic ciculation model. It is pasted below.

A weather pattern centred on the Indian Ocean may provide an early warning system for major bushfires in southern Australia, climate experts say. Dr Wenju Cai and Tim Cowan, of CSIRO's marine and atmospheric research centre, have uncovered a link between the Indian Ocean Dipole (IOD) and Victoria's killer bushfires. Dr Cai will tell the Greenhouse 2009 conference today that 11 of 16 major bushfires in Victoria since 1950 have been preceded by what is known as a positive IOD event. He says an unprecedented three consecutive positive IOD events preceded February's devastating Black Saturday bushfires. The IOD refers to temperature fluctuations in the east and western Indian Ocean.


The picture of the left demonstrates change in the sea surface temperature between the western and eastern Indian Oceans (between month 0 and 12) which is apparently a very strong predictor for rainfall and potential bushfire threat patterns in Australia.

In its negative phase, the IOD brings cool water to the ocean west of Australia and warm water to the north, leading to winds that bring rain-bearing air over the continent. In the positive phase, water temperatures are reversed and less rainfall travels to Australia, particularly to Victoria where the negative IOD provides winter and spring rains. As part of their research, Dr Cai and Mr Cowan recorded changes in the IOD using Argo floats; robotic devices that measure the sub-surface ocean temperature.

They found the IOD was in an "unprecedented" positive state for three consecutive years leading up to 2009. They say this preconditioned the environment to the extent that it was almost inevitable the bushfires, which claimed more than 200 lives, would occur. "If you look at the accumulative soil moisture in Victoria, it's unprecedented, it's never been so dry," Dr Cai said.

The researchers also found an IOD link to the Ash Wednesday bushfires of February 1983, with a positive event reducing rainfall during the winter of 1982. Mr Cowan says of the 11 bushfires preceded by a positive IOD, six were coupled with an El Nino event. But, there was only one occasion where an El Nino alone preceded a bushfire, compared to the five times when only an IOD impacted on the rainfall. This shows the influence of the IOD was enough to precondition the environment to high bushfire risk, says Mr Cowan.

Dr Cai and Mr Cowan say climate change projections show the frequency of positive IOD events will increase in the future. "Almost all climate models say under climate change we are going to have an Indian Ocean warming pattern," Dr Cai said. "That means it has to be manifested in either more frequent positive IOD events or higher intensity positive IODs."

According to Dr Cai, the effects of climate change can already be seen. Between 1900 and 1930 there were four positive IOD events, he says. But in the past 30 years there have been 12 positive IODs, a 400 per cent increase. For Victorian residents living in bushfire-prone areas that is bad news. Dr Cai says the continued suppression of rainfall in Victoria will only make conditions more fire friendly. "The implication [of the research] is if we have a positive IOD in one year then the following season you have a higher bushfire risk," he said. According to Dr Cai this knowledge could provide an early warning system. "It gives us four to five months' lead time [to prepare for bushfires]," he said.

He says modelling shows that climate change will also lead to a 30 per cent increase in the number of consecutive events, while the odds of three consecutive IODs occurring increases by 300 per cent. "In 1,000 virtual years without climate change we get two occurrences [of three consecutive positive IOD events]. With climate change factored into the modelling this becomes eight."

The research is due to be published in a series of papers in the Geophysical Research Letters.

Tuesday 10 March 2009

The synergistic environmental/economic crisis.

Haven't posted for a while, but I received an interesting email from a subscribed post-doc fellows email list here at Griffith Uni. It is an opinion piece by Thomas Friedman from the March 7th opinion pages of the New York Times. Thomas is a regular columnist with the New York Times and a Pulitzer Prize winning author. This article outlines the economical and ecological unsustainable outcome of the ubiquitous 'growth model' that we hear the politicians and business sectors so vehemently following. A great short article on what is so bleedingly obvious; consumerism and corporate greed spells synergistic environmental and economic collapse!

The Inflection Is Near?

By THOMAS L. FRIEDMAN
Published in The New York Times, March 7, 2009

Sometimes the satirical newspaper The Onion is so right on, I can’t resist quoting from it. Consider this faux article from June 2005 about America’s addiction to Chinese exports:

FENGHUA, China — Chen Hsien, an employee of Fenghua Ningbo Plastic Works Ltd., a plastics factory that manufactures lightweight household items for Western markets, expressed his disbelief Monday over the “sheer amount of [garbage] Americans will buy. Often, when we’re assigned a new order for, say, ‘salad shooters,’ I will say to myself, ‘There’s no way that anyone will ever buy these.’ ... One month later, we will receive an order for the same product, but three times the quantity. How can anyone have a need for such useless [garbage]? I hear that Americans can buy anything they want, and I believe it, judging from the things I’ve made for them,” Chen said. “And I also hear that, when they no longer want an item, they simply throw it away. So wasteful and contemptible.”
Let’s today step out of the normal boundaries of analysis of our economic crisis and ask a radical question: What if the crisis of 2008 represents something much more fundamental than a deep recession? What if it’s telling us that the whole growth model we created over the last 50 years is simply unsustainable economically and ecologically and that 2008 was when we hit the wall — when Mother Nature and the market both said: “No more.”

We have created a system for growth that depended on our building more and more stores to sell more and more stuff made in more and more factories in China, powered by more and more coal that would cause more and more climate change but earn China more and more dollars to buy more and more U.S. T-bills so America would have more and more money to build more and more stores and sell more and more stuff that would employ more and more Chinese ...

We can’t do this anymore.

“We created a way of raising standards of living that we can’t possibly pass on to our children,” said Joe Romm, a physicist and climate expert who writes the indispensable blog climateprogress.org. We have been getting rich by depleting all our natural stocks — water, hydrocarbons, forests, rivers, fish and arable land — and not by generating renewable flows.

“You can get this burst of wealth that we have created from this rapacious behavior,” added Romm. “But it has to collapse, unless adults stand up and say, ‘This is a Ponzi scheme. We have not generated real wealth, and we are destroying a livable climate ...’ Real wealth is something you can pass on in a way that others can enjoy.”

Over a billion people today suffer from water scarcity; deforestation in the tropics destroys an area the size of Greece every year — more than 25 million acres; more than half of the world’s fisheries are over-fished or fished at their limit.

“Just as a few lonely economists warned us we were living beyond our financial means and overdrawing our financial assets, scientists are warning us that we’re living beyond our ecological means and overdrawing our natural assets,” argues Glenn Prickett, senior vice president at Conservation International. But, he cautioned, as environmentalists have pointed out: “Mother Nature doesn’t do bailouts.”

One of those who has been warning me of this for a long time is Paul Gilding, the Australian environmental business expert. He has a name for this moment — when both Mother Nature and Father Greed have hit the wall at once — “The Great Disruption.”

“We are taking a system operating past its capacity and driving it faster and harder,” he wrote me. “No matter how wonderful the system is, the laws of physics and biology still apply.” We must have growth, but we must grow in a different way. For starters, economies need to transition to the concept of net-zero, whereby buildings, cars, factories and homes are designed not only to generate as much energy as they use but to be infinitely recyclable in as many parts as possible. Let’s grow by creating flows rather than plundering more stocks.

Gilding says he’s actually an optimist. So am I. People are already using this economic slowdown to retool and reorient economies. Germany, Britain, China and the U.S. have all used stimulus bills to make huge new investments in clean power. South Korea’s new national paradigm for development is called: “Low carbon, green growth.” Who knew? People are realizing we need more than incremental changes — and we’re seeing the first stirrings of growth in smarter, more efficient, more responsible ways.

In the meantime, says Gilding, take notes: “When we look back, 2008 will be a momentous year in human history. Our children and grandchildren will ask us, ‘What was it like? What were you doing when it started to fall apart? What did you think? What did you do?’ ” Often in the middle of something momentous, we can’t see its significance. But for me there is no doubt: 2008 will be the marker — the year when ‘The Great Disruption’ began.